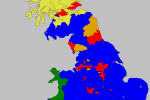
 United Kingdom. European Parliament Election 2009
By Alex Kireev
CON – Conservative Party
UKIP – UK Independence Party
LAB – Labor
LD – Liberal Democrat
GRN – Green
BNP – British National Party
SNP – Scottish National Party
PC – Plaid Cymru
| CON | UKIP | LAB | LD | GRN | BNP | SNP | PC | |
| National result | 27.7 | 16.5 | 15.7 | 13.7 | 8.6 | 6.2 | 2.1 | 0.8 |
| East Midlands | 30.6 | 16.4 | 16.9 | 12.3 | 6.8 | 8.7 | ||
| East of England | 31.2 | 19.6 | 10.5 | 13.8 | 8.8 | 6.1 | ||
| London | 27.4 | 10.9 | 21.3 | 21.3 | 10.9 | 4.9 | ||
| North East | 19.8 | 15.4 | 25 | 17.6 | 5.8 | 8.9 | ||
| North West | 25.6 | 15.8 | 20.4 | 14.3 | 7.7 | 8 | ||
| Scotland | 16.8 | 5.2 | 20.8 | 11.5 | 7.3 | 2.5 | 29.1 | |
| South East | 34.8 | 18.8 | 8.2 | 14.1 | 11.6 | 4.4 | ||
| South West | 30.2 | 22.1 | 7.7 | 17.2 | 9.3 | 3.9 | ||
| Wales | 21.2 | 12.8 | 20.3 | 10.7 | 5.6 | 5.4 | 18.5 | |
| West Midlands | 28.1 | 21.3 | 17 | 12 | 6.2 | 8.6 | ||
| Yorkshire and the Humber | 24.5 | 17.4 | 18.8 | 13.2 | 8.5 | 9.8 |


John D. Froelich | Jun 23, 2009 | Reply
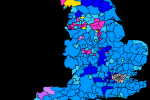
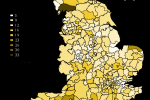
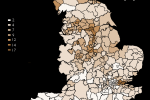
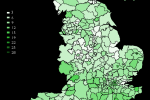
This is misleading: The title says United Kingdom, yet the statistics and maps are for England only. We are missing Scotland, wales, north Ireland and the minor islands.
John D. Froelich | Jun 23, 2009 | Reply
Sorry about the above, it is only the maps that are off.