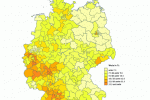
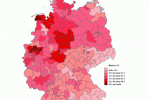
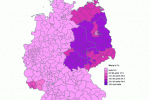
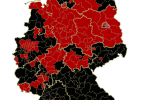
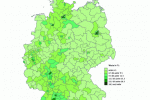
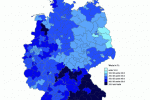
 Germany. Legislative Election 2005
By Alex Kireev
| Regions | SPD (%) | CDU-CSU (%) | Green Party (%) | Free Democrats (%) | Left Party (%) |
|---|---|---|---|---|---|
| 1. Baden-Wurttemberg | 30.1 | 39.2 | 10.7 | 11.9 | 3.8 |
| 2. Bavaria | 25.5 | 49.2 | 7.7 | 9.5 | 3.4 |
| 3. Berlin | 34.3 | 22 | 13.7 | 8.2 | 16.4 |
| 4. Brandenburg | 35.8 | 20.6 | 5.1 | 6.9 | 26.6 |
| 5. Bremen | 42.9 | 22.8 | 14.3 | 8.1 | 8.4 |
| 6. Hamburg | 38.7 | 28.9 | 14.9 | 9 | 6.3 |
| 7. Hessen | 35.6 | 33.7 | 10.1 | 11.7 | 5.3 |
| 8. Mecklenburg-Western Pomerania | 31.7 | 29.6 | 4 | 6.3 | 23.7 |
| 9. Lower Saxony | 43.2 | 33.6 | 7.4 | 8.9 | 4.3 |
| 10. North Rhine-Westphalia | 40 | 34.4 | 7.6 | 10 | 5.2 |
| 11. Rhineland-Palatinate | 34.6 | 36.9 | 7.3 | 11.7 | 5.6 |
| 12. Saarland | 33.3 | 30.2 | 5.9 | 7.4 | 18.5 |
| 13. Saxony | 24.5 | 30 | 4.8 | 10.2 | 22.8 |
| 14. Saxony-Anhalt | 32.7 | 24.7 | 4.1 | 8.1 | 26.6 |
| 15. Schleswig-Holstein | 38.2 | 36.4 | 8.4 | 10.1 | 4.6 |
| 16. Thuringia | 29.8 | 25.7 | 4.8 | 7.9 | 26.1 |
| Total | 34.2 | 35.2 | 8.1 | 9.8 | 8.7 |
You can find beautiful maps at the Online Atlas of Bundestag Elections at:
http://www.bundeswahlleiter.de/bundestagswahl2005/onlineatlas/
To view maps there first download Adobe SVG plugin.
Maps and Data could be also retrieved in a PDF-file:
http://www.bundeswahlleiter.de/bundestagswahl2005/downloads/heft2_mit_grafiken.pdf
Thanks to Claudia Hock!


