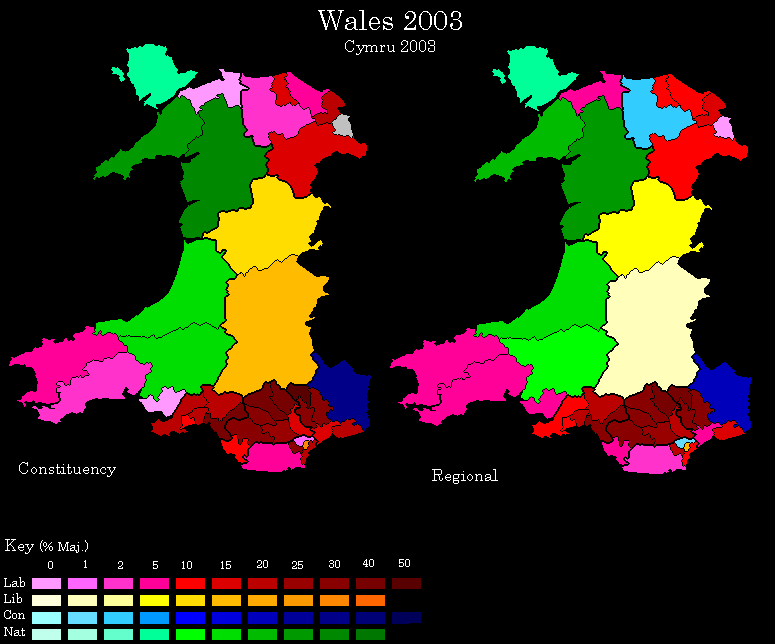
| Labour | Plaid Cymru | Cons | LibDem | UKIP | |
| TOTAL | 36.6% | 19.7% | 19.2% | 12.7% | 3.5% |
| Mid and West Wales | 25.2% | 28.2% | 19.3% | 16.4% | 3.2% |
| North Wales | 31.6% | 23.8% | 22.0% | 10.0% | 2.8% |
| South Wales Central | 41.1% | 15.4% | 18.5% | 13.8% | 3.8% |
| South Wales East | 45.1% | 12.6% | 20.2% | 10.4% | 3.5% |
| South Wales West | 41.6% | 17.8% | 15.0% | 12.7% | 4.4% |
 Source:
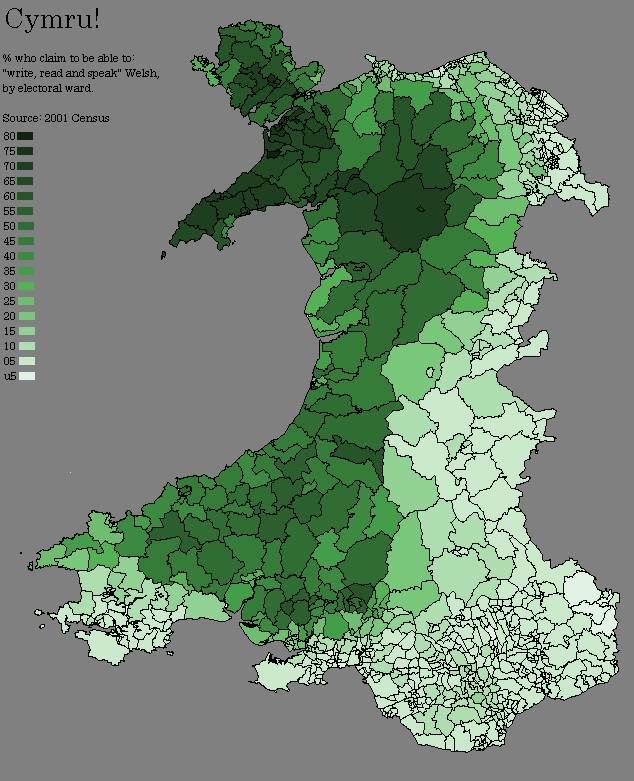
http://i21.photobucket.com/albums/b276/CSoc45/cymru.png
Map one shows the % of Welsh speakers (ie; those who claim to read, write and speak Welsh), Map two shows the % that identified themselves as Welsh.

http://img84.imageshack.us/img84/1272/untitledco7.png
http://img84.imageshack.us/img84/1272/untitledco7.png
 Add to Del.icio.us
 Add to Digg!