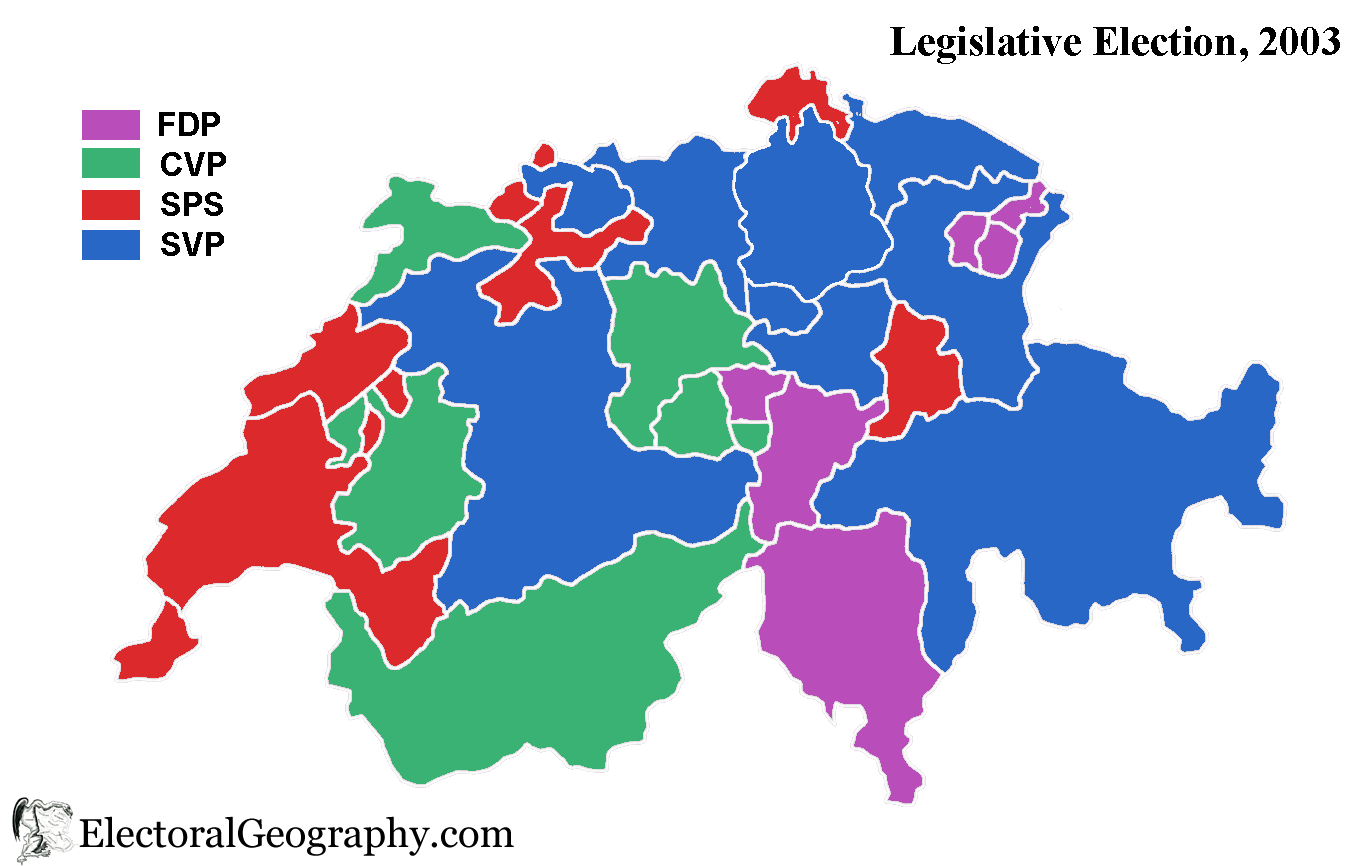
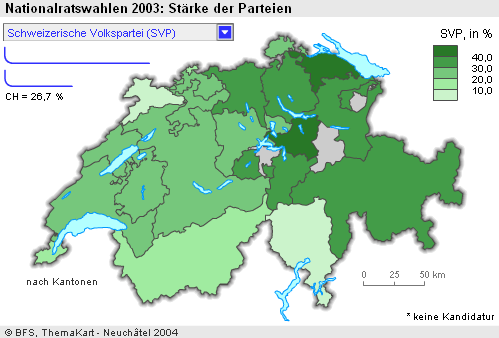
Swiss People's Party |
SVP/UDC |
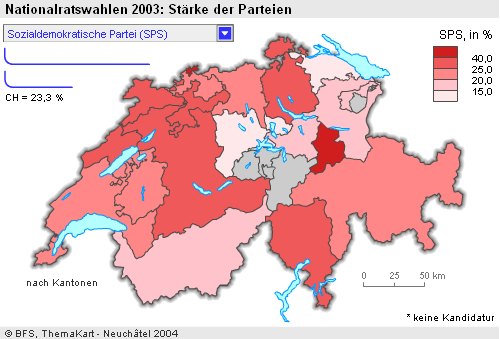
Social Democratic Party of Switzerland |
SPS/PSS |
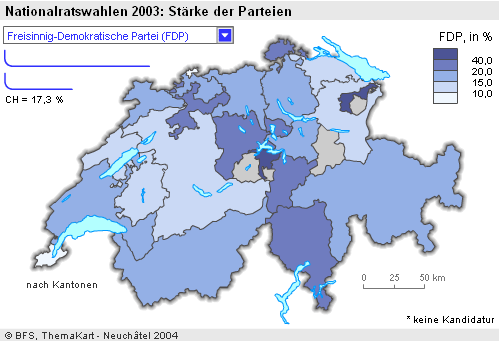
Free Democratic Party of Switzerland |
FDP/PRD |
Christian Democratic People's Party of Switzerland |
CVP/PDC |
Green Party of Switzerland |
GPS/PES |
| FDP | CVP | SPS | SVP | GPS | |
| Total | 17.3 | 14.4 | 23.3 | 26.7 | 7.4 |
| Zürich | 16.2 | 5.4 | 25.7 | 33.4 | 8.9 |
| Bern | 14.8 | 2.3 | 28 | 29.6 | 9.3 |
| Luzern | 23.1 | 29.4 | 11.1 | 22.9 | 9.3 |
| Uri | 36.6 | 31.3 | 30.6 | ||
| Schwyz | 15.4 | 23.4 | 17.6 | 43.6 | |
| Obwalden | 66.4 | 33.6 | |||
| Nidwalden | 88.5 | ||||
| Glarus | 67.1 | ||||
| Zug | 22.4 | 22.9 | 13.4 | 27.7 | |
| Freiburg | 12.8 | 25.4 | 21.5 | 21.4 | |
| Solothurn | 24 | 21 | 25.4 | 22.5 | |
| Basel-Stadt | 9.9 | 6.6 | 40.9 | 18.6 | 9.2 |
| Basel-Landschaft | 19.9 | 10 | 24.7 | 26.5 | 12.6 |
| Schaffhausen | 29.1 | 2.7 | 39.7 | 28.5 | |
| Appenzell Ausserrhoden | 41.1 | 19.9 | 38.3 | ||
| Appenzell Innerrhoden | 69.2 | ||||
| Gallen | 14.7 | 22.2 | 18.4 | 33.1 | 7.1 |
| Graubünden | 15.8 | 23.5 | 24.9 | 33.9 | |
| Aargau | 15.3 | 15.6 | 21.2 | 34.6 | 5.1 |
| Thurgau | 11.9 | 16.5 | 14.1 | 41 | 7.9 |
| Tessin | 29.8 | 24.6 | 25.8 | 7.6 | 3 |
| Waadt | 18.5 | 4.4 | 21.7 | 20.3 | 11.3 |
| Wallis | 17.1 | 47.9 | 19.1 | 13.4 | 2.6 |
| Neuenburg | 14.8 | 29.2 | 22.5 | 13.8 | |
| Genf | 7.3 | 11.8 | 24.8 | 18.3 | 11.2 |
| Jura | 16.3 | 39.4 | 34.2 | 8.3 |
http://www.politik-stat.ch/nrw2003/CH/index.shtml
 Add to Del.icio.us
 Add to Digg!