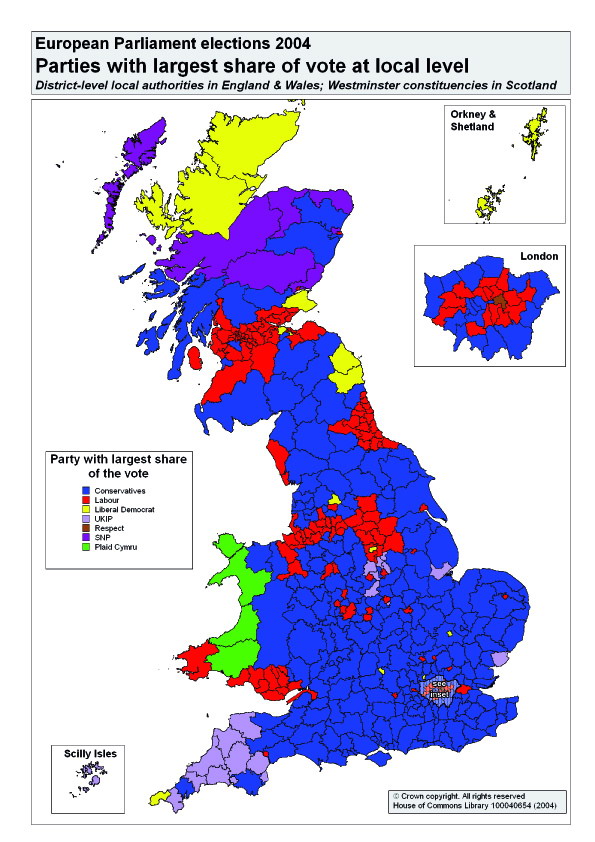
| Conservative | Labour | UK Independence | Liberal Democrat | Green | British National | Skottissh National Party | Plaid Cymru | Democratic Unionist | Sinn Féin | Ulster Unionist | Social Democratic & Labour | |
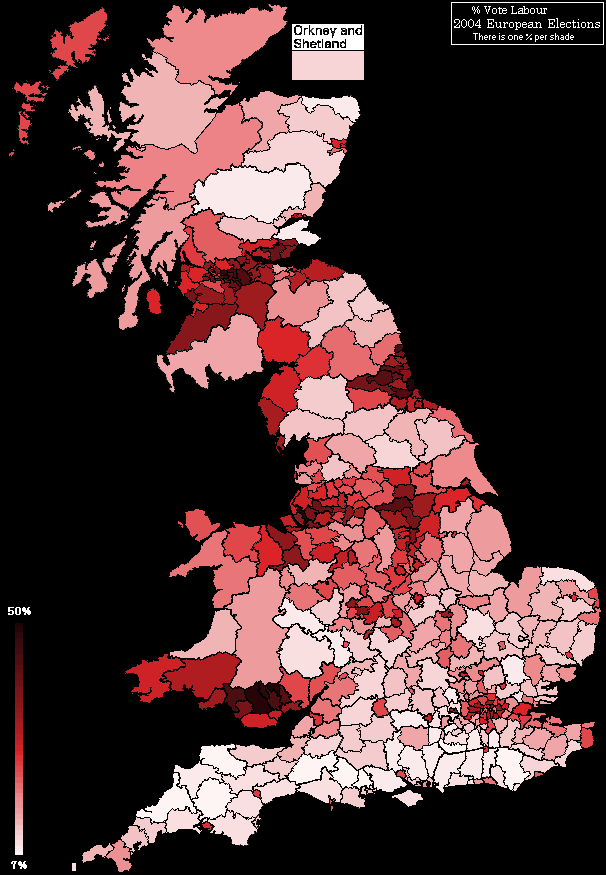
| United Kingdom | 26.7% | 22.6% | 16.1% | 14.9% | 6.3% | 4.9% | ||||||
| East Midlands | 26.4% | 21.0% | 26.1% | 12.9% | 6.5% | 5.5% | ||||||
| Eastern | 30.8% | 16.2% | 19.6% | 14.0% | 5.6% | 4.3% | ||||||
| London | 26.8% | 24.8% | 12.3% | 15.3% | 8.4% | 4.0% | ||||||
| North East | 18.6% | 34.1% | 12.2% | 17.8% | 4.8% | 6.4% | ||||||
| North West | 24.2% | 27.4% | 11.7% | 15.9% | 5.6% | 6.4% | ||||||
| South East | 35.2% | 13.7% | 19.5% | 15.3% | 7.9% | 2.9% | ||||||
| South West | 31.6% | 14.5% | 22.6% | 18.3% | 7.2% | 3.0% | ||||||
| West Midlands | 27.3% | 24.3% | 17.5% | 13.7% | 5.2% | 7.5% | ||||||
| Yorkshire and Humber | 24.6% | 26.3% | 14.5% | 15.6% | 5.7% | 8.0% | ||||||
| Scotland | 17.8% | 26.4% | 6.7% | 13.1% | 6.8% | 1.7% | 19.7% | |||||
| Wales | 19.4% | 32.5% | 10.5% | 10.2% | 3.6% | 3.0% | ||||||
| Northern Ireland | 17.4% | 31.9% | 26.3% | 16.6% | 15.9% |
http://en.wikipedia.org/wiki/European_Parliament_election%2C_2004_%28UK%29
 Source
:
Source
:http://www.parliament.uk/commons/lib/research/rp2004/rp04-050.pdf

 UK Independence Party:
  Liberal Democrats:
 British National Party:

 Add to Del.icio.us
 Add to Digg!