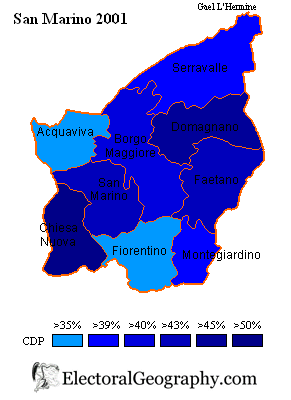
| Sammarinese Christian Democratic Party | Sammarinese Socialist Party | Party of Democrats | Popular Alliance of Sammarinese Democrats for the Republic | Sammarinese Communist Refoundation | Sammarinese National Alliance | |
| Total | 41.45% | 24.18% | 20.81% | 8.93% | 3.39% | 1.93% |
| The City of San Marino | 43.42% | 20.91% | 18.18% | 10.82% | 4.24% | 2.43% |
| Borgo Maggiore | 40.59% | 25.20% | 17.79% | 11.14% | 2.76% | 2.52% |
| Serravalle | 39.95% | 22.66% | 24.80% | 7.53% | 3.52% | 1.55% |
| Acquaviva | 37.22% | 27.26% | 23.81% | 6.89% | 3.14% | 2.68% |
| Chiesanuova | 53.91% | 17.34% | 17.90% | 5.26% | 4.47% | 1.12% |
| Domagnano | 46.60% | 23.22% | 17.01% | 7.79% | 2.05% | 3.32% |
| Faetano | 43.73% | 26.10% | 20.02% | 3.59% | 5.28% | 1.29% |
| Fiorentino | 36.04% | 31.75% | 23.94% | 4.96% | 1.92% | 1.39% |
| Montegiardino | 39.11% | 35.93% | 17.46% | 5.34% | 1.30% | 0.87% |
http://www.elezioni2006.sm/elezioni2006/index2.jsp
 Add to Del.icio.us
 Add to Digg!