FF - Fianna Fáil - The Republican Party
FG - Fine Gael - The United Ireland Party
LAB - Labour Party
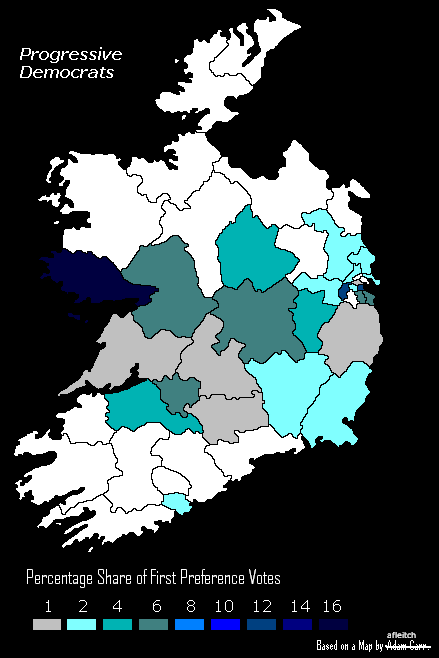
PD - Progressive Democrats
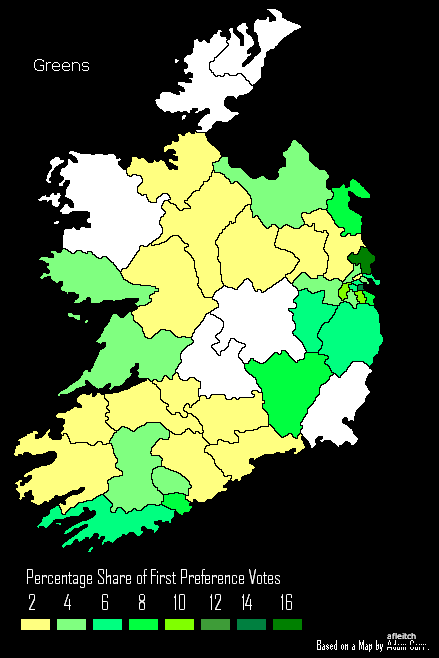
GP - Green Party
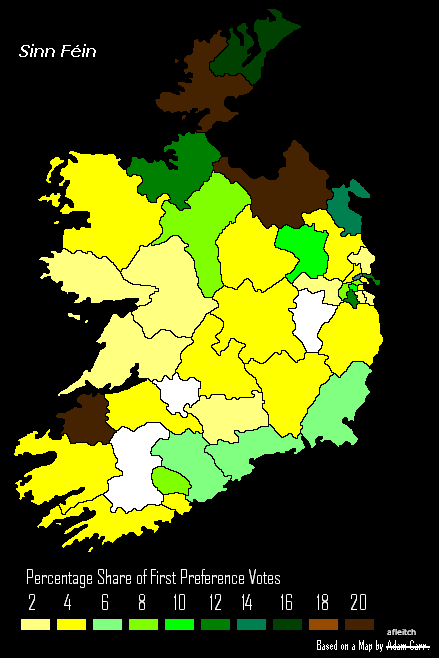
SF - Sinn Féin
| FF | FG | LAB | PD | GP | SF | |
| Total | 41.6% | 27.3% | 10.1% | 2.7% | 4.7% | 6.9% |
| Carlow Kilkenny | 47.7% | 29.6% | 9.3% | 1.6% | 8.0% | 3.8% |
| Cavan Monaghan | 37.8% | 31.2% | 1.2% | 0.0% | 3.6% | 20.0% |
| Clare | 44.0% | 35.2% | 1.6% | 1.4% | 5.1% | 3.4% |
| Cork East | 38.0% | 30.9% | 20.9% | 0.0% | 2.9% | 6.8% |
| Cork North Central | 35.7% | 27.6% | 12.3% | 0.0% | 3.5% | 8.2% |
| Cork North West | 53.1% | 38.4% | 4.9% | 0.0% | 3.6% | 0.0% |
| Cork South Central | 44.3% | 28.4% | 9.3% | 2.7% | 8.4% | 5.1% |
| Cork South West | 42.6% | 36.0% | 9.6% | 0.0% | 6.7% | 5.1% |
| Donegal North East | 50.3% | 22.6% | 1.8% | 0.0% | 1.3% | 17.5% |
| Donegal South West | 50.5% | 23.0% | 2.8% | 0.0% | 1.5% | 21.2% |
| Dublin Central | 44.5% | 9.5% | 12.6% | 0.6% | 5.6% | 9.2% |
| Dublin Mid West | 33.0% | 12.0% | 10.9% | 12.5% | 10.8% | 9.3% |
| Dublin North | 42.1% | 14.0% | 9.6% | 2.6% | 16.7% | 2.7% |
| Dublin North Central | 44.0% | 25.5% | 7.3% | 0.0% | 5.2% | 3.8% |
| Dublin North East | 39.7% | 22.9% | 15.2% | 2.1% | 6.7% | 13.3% |
| Dublin North West | 48.8% | 10.0% | 20.3% | 0.0% | 2.8% | 15.7% |
| Dublin South | 41.3% | 27.3% | 10.4% | 6.6% | 11.1% | 3.0% |
| Dublin South Central | 33.1% | 14.4% | 21.1% | 1.9% | 5.8% | 10.2% |
| Dublin South East | 28.7% | 18.6% | 16.7% | 13.1% | 13.8% | 4.7% |
| Dublin South West | 39.3% | 20.0% | 20.0% | 0.0% | 3.7% | 12.2% |
| Dublin West | 37.4% | 20.4% | 17.1% | 1.6% | 3.8% | 4.8% |
| Dun Laoghaire | 34.9% | 23.6% | 16.0% | 6.7% | 7.7% | 2.2% |
| Galway East | 39.7% | 39.1% | 3.1% | 6.0% | 1.9% | 3.2% |
| Galway West | 37.1% | 20.4% | 11.0% | 16.1% | 5.5% | 3.0% |
| Kerry North | 31.3% | 32.3% | 10.9% | 0.0% | 1.9% | 20.4% |
| Kerry South | 40.7% | 25.1% | 13.5% | 0.0% | 1.9% | 3.5% |
| Kildare North | 50.4% | 17.2% | 20.7% | 4.4% | 6.2% | 0.0% |
| Kildare South | 39.5% | 21.2% | 17.4% | 2.2% | 4.9% | 2.4% |
| Laoighis Offaly | 56.4% | 27.4% | 2.4% | 5.9% | 1.1% | 5.1% |
| Limerick East | 48.7% | 25.5% | 10.3% | 6.8% | 2.6% | 4.2% |
| Limerick West | 47.2% | 40.0% | 5.6% | 4.8% | 2.4% | 0.0% |
| Longford Westmeath | 41.2% | 31.0% | 17.6% | 4.2% | 1.7% | 3.9% |
| Louth | 42.1% | 29.4% | 5.0% | 0.0% | 7.6% | 15.0% |
| Mayo | 24.5% | 53.8% | 1.2% | 0.4% | 0.8% | 5.1% |
| Meath East | 43.6% | 25.9% | 11.9% | 2.2% | 3.1% | 3.9% |
| Meath West | 51.6% | 29.0% | 4.0% | 0.0% | 2.5% | 11.3% |
| Roscommon Leitrim South | 38.8% | 39.1% | 1.8% | 0.0% | 1.8% | 8.4% |
| Sligo Leitrim North | 41.0% | 39.3% | 3.9% | 0.0% | 3.0% | 11.7% |
| Tipperary North | 34.3% | 15.9% | 10.3% | 1.4% | 1.1% | 3.8% |
| Tipperary South | 46.4% | 21.1% | 8.8% | 1.4% | 1.5% | 3.1% |
| Waterford | 46.5% | 27.4% | 11.3% | 0.0% | 2.1% | 6.7% |
| Wexford | 42.2% | 31.6% | 13.8% | 3.2% | 1.2% | 7.4% |
| Wicklow | 38.1% | 23.2% | 16.3% | 1.4% | 7.4% | 5.0% |
http://www.rte.ie/news/elections2007/index.html


 Add to Del.icio.us
 Add to Digg!