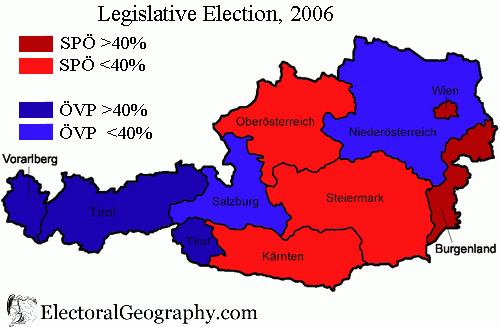
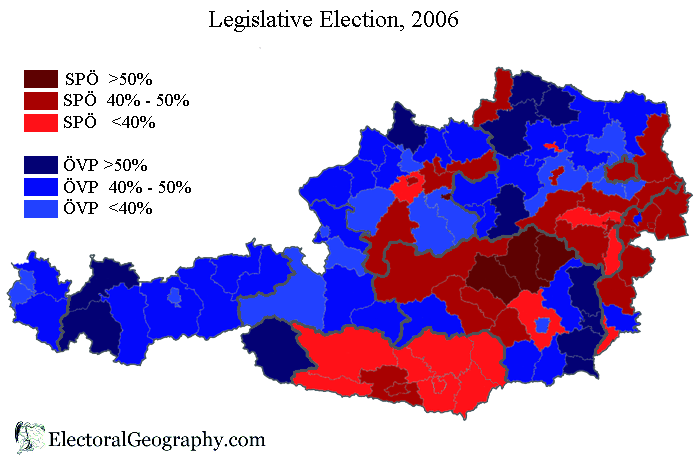
Austria. Legislative Election 2006
Parties:
SPÖ - Sozialdemokratische Partei Österreichs (
Social Democratic Party
of Austria)
ÖVP - Österreichische Völkspartei (
Austrian People's Party)
FPÖ - Freiheitliche Partei Österreichs (
Freedom Party of Austria)
- Die Grünen (
The Greens)
BZÖ - Bündnis Zukunft Österreich
(Alliance for the Future of Austria)
| Total |
34.2 |
35.7 |
11.2 |
10.5 |
4.1 |
| Burgenland |
36.1 |
45.3 |
8.7 |
5.5 |
1.7 |
| Carinthia (Kärnten) |
20.8 |
35.8 |
7.3 |
6.9 |
24.9 |
| Lower Austria (Niederösterreich) |
39.2 |
36.4 |
9.7 |
8.6 |
2.3 |
| Upper Austria (Oberösterreich) |
35.1 |
36.5 |
12.4 |
9.6 |
2.6 |
| Salzburg |
39.1 |
28.8 |
12.6 |
11.8 |
3.1 |
| Styria (Steiermark) |
37.3 |
37.6 |
10.6 |
7.4 |
3.2 |
| Tyrol (Tirol) |
43.9 |
23.4 |
11.0 |
12.4 |
3.3 |
| Vorarlberg |
42.1 |
18.8 |
11.2 |
15.6 |
3.2 |
| Vienna (Wien) |
20.8 |
41.8 |
14.4 |
17.1 |
1.8 |
Maps:
Source:
http://www.bmi.gv.at/wahlen/
 Add to Del.icio.us
 Add to Digg!